Server timing in an Axum web app
Coming from the C++ world, the process of building Chimera-md has been remarkably smooth. Despite not being an expert at Rust or web development, the breadth of well-considered libraries made available by the Cargo package manager made everything a breeze. The only part that’s at all clever, and therefore worth documenting, is my use of the “server-timing” HTTP header to give the client detailed timing information.
Because of Google’s search ranking algorithm, which is said to favor fast pages, web developers have a heightened sense of the need for speed. There is a surprising amount of infrastructure built up to provide detailed profiling information to every web developer. It’s part of your browser right now!
When I’m building a Markdown page response, the process goes through several transformations. It wasn’t long after having a successful page come through before I started wondering how long it was taking. I went through several iterations of trying to surface performance data before I found a satisfying solution.
-
At first I was taking advantage of the fact that Axum’s library has been instrumented with the tracing library. With some esoteric incantations, it would log verbose enter/exit messages you could scrutinize to see page response timing. This was both noisy and depended on logging, neither of which is ideal.
-
In my second pass, I calculated my own response time with Rust Instant. It isn’t quite authoritative, as it doesn’t measure the http-internal machinery, but it at least counts everything I have control over. For feedback, I put it into a custom header that got served with the pages. If you knew how to find the response headers in your browser’s Inspector panel, you could find it in there. Basically, it was invisible.
-
A friend suggested a better way to capture the timing, using Axum middleware. This adds a new layer that wrappers the inner request job, so you can hook the start and end. That let me get some better, more concise logging for every type of response, along with some relevant extra information for casual inspection. This is a marked improvement, but still requires access to the server log.
2024-07-20T02:11:37.157338Z  INFO chimera_md:191: 200: /home/index.md in 0.097 ms (cached)
2024-07-20T02:11:37.172845Z  INFO chimera_md:191: 200: /style/skeleton.css in 0.512 ms (static)
2024-07-20T02:11:37.173082Z  INFO chimera_md:191: 200: /style/chimera.css in 0.321 ms (static)
2024-07-20T02:11:37.173182Z  INFO chimera_md:191: 200: /home/style/site.css in 0.373 ms (static)
2024-07-20T02:11:37.174147Z  INFO chimera_md:191: 200: /icon/search.svg in 0.265 ms (static)
2024-07-20T02:11:37.180134Z  INFO chimera_md:191: 200: /icon/folder.svg in 0.521 ms (static)
2024-07-20T02:11:37.180176Z  INFO chimera_md:191: 200: /icon/document.svg in 0.268 ms (static)
2024-07-20T02:11:37.180178Z  INFO chimera_md:191: 200: /icon/hash.svg in 0.28 ms (static)
2024-07-20T02:11:37.188937Z  INFO chimera_md:191: 404: /favicon.ico in 0.454 ms (static)
- The thing I really wanted was to inject the timing value into the page itself. I’ve seen a handful of pages over the years that did that. Google used to do it with search results. I struggled to get it going, though. Because I want to measure how long the template system takes, I didn’t have the value ready when I was generating the HTML. I tried to stick it onto the bottom of the page result, but Rust was pretty unhappy with me for it.
One night I had this thought: “Can Javascript read the response headers?” The answer is yes, provided you use a specific header named “server-timing”. Because so many web developers care about page response times, a path was made for performance-specific data to surface in the web browser.
How it works
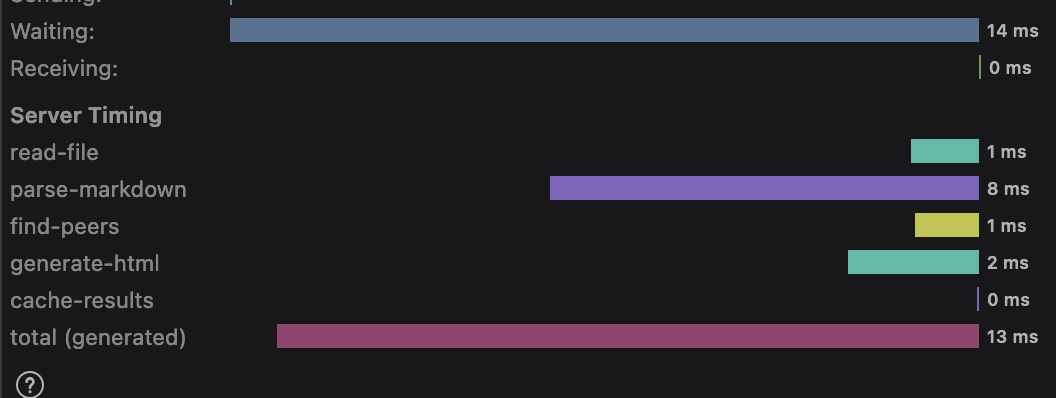
This post is a very good description. You can provide any number of “server-timing” header values (up to some cap on the overall header size), and the browser will show them under the Timings tab of Network Inspector (pictured at the top of this post). Provided they are formatted in the expected way, the browser will render them as bars in the timing chart.
"{name}; dur={time-in-milliseconds}; {desc}"
They are also readable as an array to Javascript. And once you have it in Javascript, you can stick it onto the page using the DOM API.

I started out by making a little struct to capture the performance numbers.
pub struct PerfTimer {
    prev_time: Instant,
}

impl PerfTimer {
    pub fn new() -> Self {
        PerfTimer {
            prev_time: Instant::now(),
        }
    }

    pub fn sample(&mut self, event: &'static str, headers: &mut HeaderMap) {
        if cfg!(feature = "detailed-timing") {
            let now = Instant::now();
            let elapsed = now.duration_since(self.prev_time).as_micros() as f64 / 1000.0;
            let header = format!("{event}; dur={}", elapsed);
            tracing::trace!(" - {header}");
            if let Ok(hval) = axum::http::HeaderValue::from_str(header.as_str()) {
                headers.append(SERVER_TIMING, hval);
            }
            self.prev_time = now;
        }
    }
}
If the “detailed-timing” feature is enabled in Cargo.toml (which it is by default), the code will kick in. Each time you sample(), it records the duration since the last time it was called and captures the result in the set of headers we’re going to send back.
Then, in the relevant function in the server, add the samples.
async fn serve_markdown_file(
    app_state: &mut AppStateType,
    path: &std::path::Path,
) -> Result<axum::response::Response, ChimeraError> {
    tracing::debug!("Markdown request {}", path.display());
    let mut headers = axum::http::header::HeaderMap::new();
    let html = match app_state.result_cache.get(path) {
        Some(html) => {
            if let Ok(hval) = axum::http::HeaderValue::from_str("cached") {
                headers.append(CACHED_HEADER, hval);
            }
            html
        },
        None => {
            let mut perf_timer = PerfTimer::new();
            let md_content = tokio::fs::read_to_string(path).await?;
            perf_timer.sample("read-file", &mut headers);
            let (body, scraper) = parse_markdown(md_content.as_str());
            perf_timer.sample("parse-markdown", &mut headers);
            let peers = match app_state.generate_index {
                true => {
                    app_state.file_manager.find_peers(
                        path).await
                },
                false => { PeerInfo::default() }
            };
            perf_timer.sample("find-peers", &mut headers);
            let html = app_state.html_generator.gen_markdown(
                path,
                body,
                scraper,
                peers,
            ).await?;
            perf_timer.sample("generate-html", &mut headers);
            app_state.result_cache.add(path, html.as_str()).await;
            perf_timer.sample("cache-results", &mut headers);
            if let Ok(hval) = axum::http::HeaderValue::from_str("generated") {
                headers.append(CACHED_HEADER, hval);
            }
            html
        }
    };
    Ok((StatusCode::OK, headers, Html(html)).into_response())
}
The sampling is a little more intrusive here than I would like, but I haven’t come up with a way to clean that up. But it’s worth it for my bars. My beautiful performance bars!
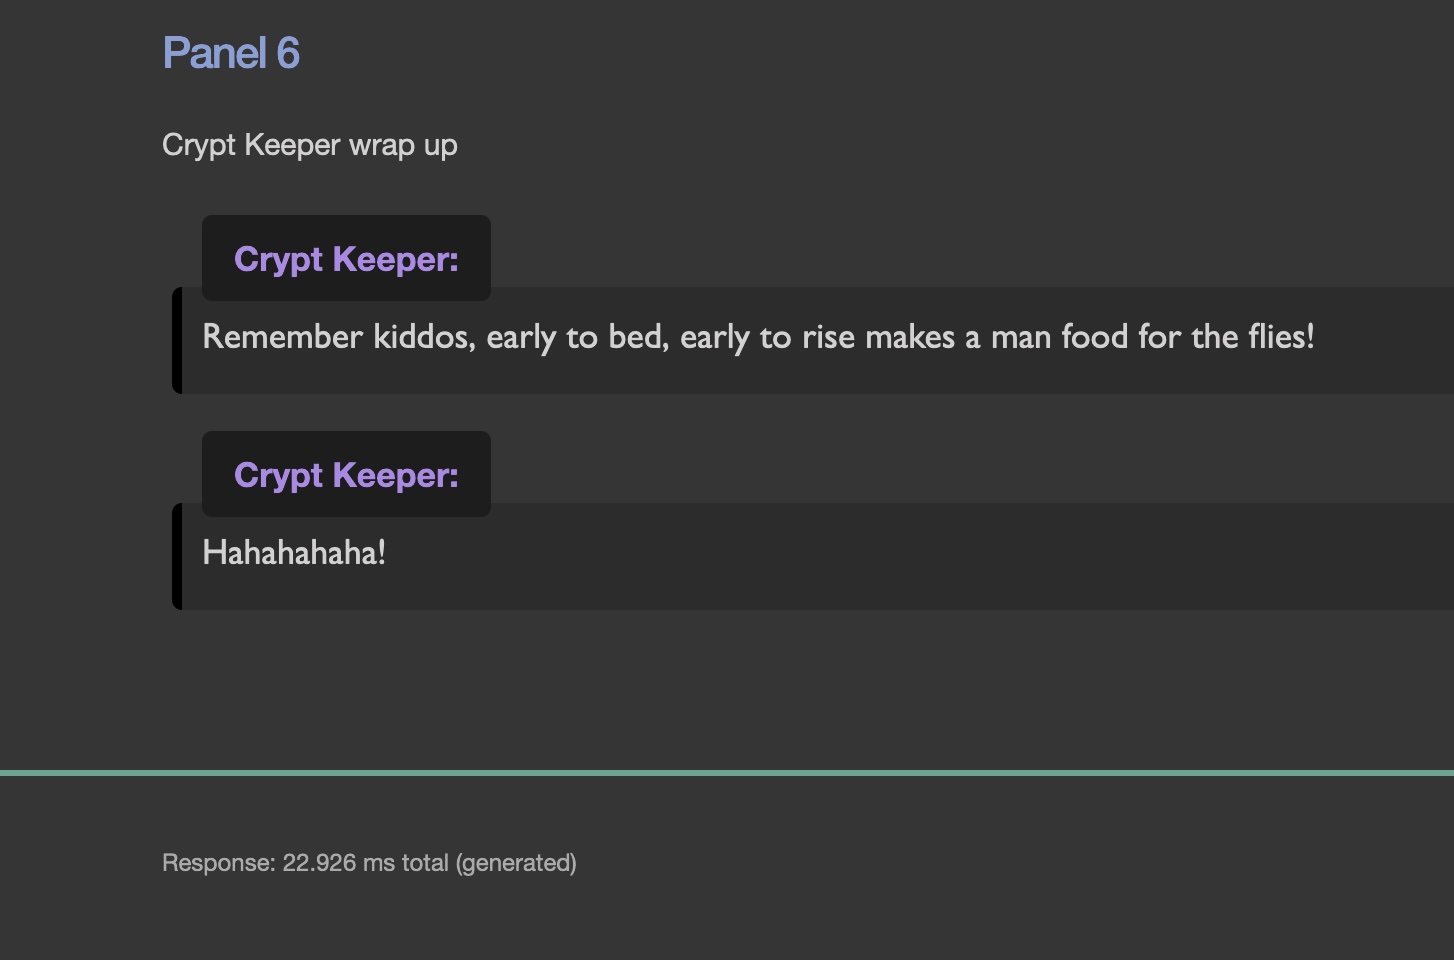
Finally, I added this little blurb to the bottom of my page template to render the total response time into an otherwise empty page element.
<footer>
  <p>
    <span id="server-timing"></span>
  </p>
  <script>
    const {serverTiming} = performance.getEntriesByType('navigation')[0];
    if (serverTiming[0]) {
      var dur = serverTiming.at(-1).duration;
      var desc = serverTiming.at(-1).description;
      if (dur != null && desc != null) {
        document.getElementById("server-timing").innerHTML = `Response: ${dur} ms ${desc}`;
      }
    }
  </script>
</footer>
Lessons leaned
I regularly run Chimera-md on two different machines. My laptop is where I do most of the development. It has a fast SSD drive, the I/O time is negligible. When I first started getting detailed breakdowns, the bulk of the time was split between parsing the Markdown and running the HTML template generation.
On the NAS, which hosts my “real” instance of the server and has old-fashioned spinning hard drives, I/O is the bulk of the cost. The screenshot at the top is taken from the NAS. It’s 86% I/O time!
Having those numbers made the job I did last weekend particularly rewarding. I swapped out the Handlebars template library for Tera. Not only was it a more capable and better documented library, it is blisteringly fast! Now that is an insignificant part of the total cost compared to Markdown parsing or I/O.

